
Heatmaps are one of the most misunderstood visual tools in football analysis. In La Liga, where tactical discipline and spatial control shape matches, heatmaps reveal tendencies that statistics alone cannot capture. However, reading them correctly requires understanding what they show, what they hide, and how team behavior distorts visual intensity. This analysis explains how La Liga team heatmaps should be interpreted for practical understanding rather than surface-level conclusions.
What a team heatmap actually represents
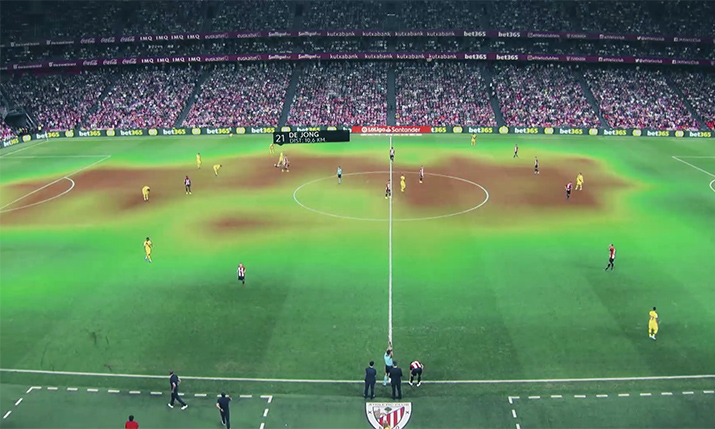
A heatmap is a density visualization of where actions occur, not where quality emerges. The cause is repeated presence in zones; the outcome is color intensity; the impact is a perception of dominance that may or may not reflect control.
In La Liga, teams with structured buildup often generate strong heatmap signals in non-threatening areas. Without understanding this, analysts mistake circulation for initiative. Heatmaps describe behavior frequency, not effectiveness.
Why La Liga heatmaps look different from other leagues
La Liga’s tactical culture emphasizes spacing, patience, and positional responsibility. This shapes heatmaps into cleaner, more predictable patterns compared to leagues with higher transitional chaos.
The cause is slower tempo and defined roles; the outcome is concentrated zones of activity; the impact is clearer structural fingerprints. Fullbacks, pivots, and interior midfielders appear prominently, even when chance creation remains limited.
Identifying attacking intent through heatmap distribution
Attacking intent is not shown by how much red appears, but where it appears. Central density near the half-space edges often signals probing rather than penetration.
Before identifying patterns, context matters. Teams may overload zones deliberately to draw defenders, not to attack directly. The explanation below clarifies how intent emerges from placement rather than volume.
- High intensity in wide midfield zones without box presence
- Central midfield dominance with low penalty-area activity
- Strong half-space occupation but limited final-third overlap
- Defensive half saturation during controlled buildup phases
Interpreting this list shows that attacking intent can stall before it becomes threat. Heatmaps reveal where attacks slow down, not where they succeed.
Defensive structure revealed by heatmaps
Defensive heatmaps expose discipline more than aggression. Teams that defend well often show compact, rectangular blocks rather than scattered intensity.
The cause is zonal responsibility; the outcome is consistent spacing; the impact is reduced central access for opponents. In La Liga, teams prioritizing defensive balance display symmetrical heatmaps that shift laterally rather than vertically.
Comparing team styles using heatmap profiles
Heatmaps become most useful when compared across teams or matches. Relative differences matter more than absolute intensity.
The table below compares common La Liga heatmap profiles and what they indicate tactically.
| Heatmap Profile | Spatial Pattern | Tactical Meaning | Match Impact |
| Central-heavy | Dense middle third | Tempo control | Low volatility |
| Wide-dominant | Touchline intensity | Crossing reliance | Low conversion |
| Deep-block | Defensive half saturation | Survival focus | Draw-prone |
| Box-focused | Penalty-area density | Direct penetration | High efficiency |
This comparison shows that similar possession numbers can produce radically different spatial behaviors. Heatmaps contextualize style rather than success.
Heatmaps and market interpretation
From a market comparison perspective, heatmaps often influence perception indirectly. Analysts, previews, and public narratives interpret spatial dominance as superiority.
Under situational conditions where visual dominance outweighs result-based evidence, observation leads to implication before reference. During this process, ufabet app may be examined as part of a broader betting environment review, not to validate decisions, but to observe whether odds reflect territorial heatmap dominance rather than actual chance quality. When pricing leans on spatial control alone, misinterpretation becomes systemic rather than accidental.
When heatmaps become misleading
Heatmaps fail when removed from context. Match state, opponent behavior, and tactical intent distort meaning.
Conditional scenarios that distort heatmap interpretation
Heatmaps mislead when teams chase a goal late, defend a lead early, or face asymmetric opposition quality. In these cases, intensity reflects necessity rather than identity, reducing analytical value unless adjusted for context.
Combining heatmaps with other data layers
Heatmaps gain value when combined with event-based data. Alone, they show where; together, they explain why.
Before outlining integration, context is essential. Heatmaps answer spatial questions, not outcome questions. The explanation below clarifies how layering improves insight.
- Pair heatmaps with shot location data
- Overlay pass progression metrics
- Compare with expected goals zones
- Adjust for possession length and match state
Interpreting this sequence shows that heatmaps are starting points, not conclusions. They guide attention toward zones that require deeper analysis.
Summary
Analyzing La Liga team heatmaps requires understanding that visual intensity reflects behavior frequency, not effectiveness. Spatial patterns reveal structure, intent, and discipline, but only when interpreted within tactical and contextual limits. When combined with complementary data and stripped of narrative bias, heatmaps become a powerful tool for understanding how La Liga teams truly operate on the pitch.